What is Power BI?
Microsoft’s Power BI is a business intelligence service package that is hosted in the cloud. To convert raw data into useful information, it employs simple visualizations and tables. Data is simple to examine and put to use in making important business choices. Power BI is a combination of software services, applications, and data connections for business intelligence and data visualization.
The datasets uploaded into Power BI may be used for data visualization and analysis by producing sharable reports, dashboards, and apps. Power BI is a user-friendly application that has robust drag-and-drop features as well as self-service capabilities. Power BI may be installed on-premises or in the cloud.
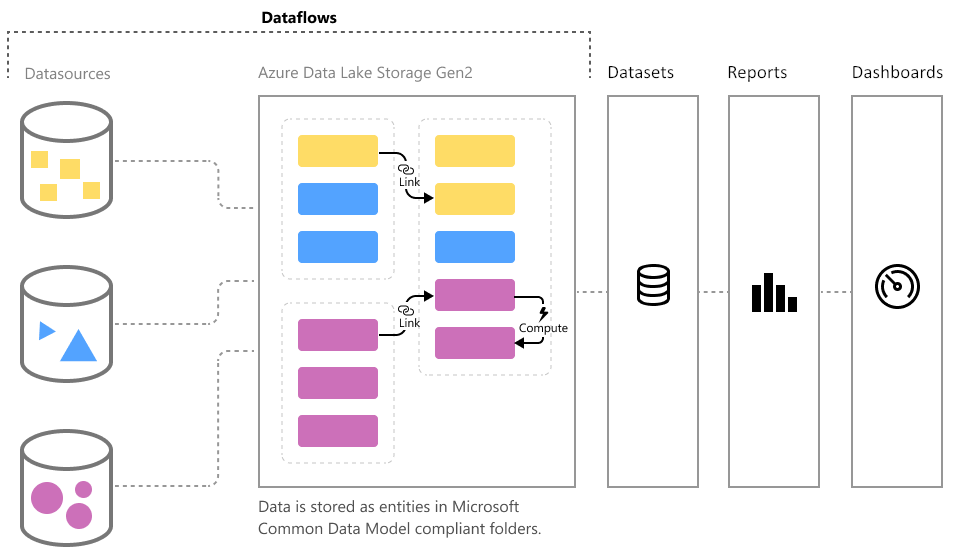
Power BI Architecture
Advantages Of Power BI:
Let’s take a look at some of Power BI’s most important features, each of which contributes to the tool’s success.
1. Affordable Pricing
One of the most appealing aspects of using Power BI for data analysis and visualization is its low cost. Power BI Desktop is a free download. You may download it and use it to create reports and dashboards on your computer. The Power BI Cloud service solution is available for $9.99 per user per month if you want to leverage more Power BI capabilities and publish your reports to the cloud. As a consequence, Power BI is fairly priced when compared to other BI systems.
2. Personalized Visualizations
Power BI has a lot of custom visualizations, which are representations created by developers for a specific purpose. On the Microsoft Marketplace, you may get custom visuals. You can utilize Power BI custom visuals in your reports and dashboards in addition to the standard set of visualizations offered. KPIs, maps, charts, graphs, R script visuals, and other custom visualizations are all available.
3. Integration with Microsoft Excel
You may also upload and see your data in Excel format using Power BI. By choosing, filtering, and slicing data from a Power BI report or dashboard, you may export it to Excel. By launching Excel, the same data may be shown in tabular form in a spreadsheet. In other words, Power BI’s Excel connection capability allows users to access and interact with the raw data that lies behind a Power BI visualization.
4. Data Interconnection
The capacity to enter data from many sources is another important advantage of using Power BI as a data analysis tool. It links several sources including data files (such XML and JSON), Microsoft Excel, SQL Server databases, Azure sources, cloud-based sources, and online services like Facebook and Google Analytics. In addition to all of this, Power BI can directly access sources of Big Data. You will thus have access to a number of data sources from which you may connect and acquire data for analysis and reporting.
5. Frequent Updates
Microsoft offers new Power BI versions every month. Microsoft has set up a user community where individuals can share their Power BI adjustments and recommendations. The recommendations with the highest votes from other users will almost certainly be included in a future Power BI version. When a new version of Power BI is released, users will be alerted and may quickly download it. Because of the speedy and comprehensive upgrade method, Power BI has been able to include better functionality since its introduction.
6. Power BI Embedded
Power BI Embedded is another benefit of Power BI. This solution allows app developers to integrate or add Power BI reports and functionalities in their web-based or other apps. We may use this to integrate Power BI visualizations and reports into emails or web pages, reaching a larger audience.
7. Personal Gateway
Personal Gateway is a solution that you may use with Power BI to authenticate on-premise and off-premise data sources. After this tool authenticates an on-premise data source, data from that data source can be used in a cloud-hosted Power BI instance.
8. Data Accessibility
Data sources and data sets that you build while designing reports are very accessible in Power BI. All of the data you work with and import from data sources is saved in a single area. You can access that information at any time, from any location, on any platform, and as often as you choose.
9. Interactive Visualizations
The most often discussed benefit of Power BI over any other data visualization tool is its visually appealing, intuitive, and interactive representations. We may add different visuals to a report using Power BI’s simple drag-and-drop feature. We can also interact with visualization by applying filters, selecting items, and so on. In Power BI, creating and understanding data visuals is a breeze.
10. Learning is simple
Even for new users, Microsoft Power BI is designed to be useful. It is simple to use and does not require an extensive prior understanding of BI tools. Making charts, graphs, and tables from a Power BI dataset may be relatively simple if the user has a basic understanding of Excel. Slicers, which are essentially filters, can be used to narrow your reports on specific data that meets the requirements.
Disadvantages of Power BI:
After discussing the benefits, it’s time to discuss the drawbacks of Power BI.
1. Relationships between tables
Power BI specializes in handling simple table relationships in a data model. However, if there are complicated interactions between data, such as several links between tables, Power BI may not be able to manage them well. When it comes to complex relationships, you should carefully construct a data model with more unique variables so that Power BI does not mistake the relationships.
2. Visuals Configuration
You may not need to set up and customize visualizations in Power BI in most circumstances. Even if you do, Power BI doesn’t give you many options for customizing your visualizations to meet your needs. As a result, users’ visual customization possibilities are limited.
3. Crowded User Interface
Users frequently complain that Power BI’s user interface is complex and large. It’s in the sense that there are a lot of options symbols that are blocking the dashboard or report view. Most consumers with the user interface or report canvas had fewer icons and options to make it easier to navigate. A native feature is the ability to create scrolling dashboards.
4. Rigid Formulas
As we all know, DAX is the expression language used in Power BI to deal with data. Although the DAX formula can be used to execute a variety of tasks in Power BI, it is not the most user-friendly language. Sometimes your formulas in Power BI work, and sometimes they don’t. You can concatenate up to two components, but more than that necessitates the use of nesting statements.
5. Handling Massive Data Sets
Power BI can only take in roughly 2 GB of data at a time. You’ll need to switch from the free edition to the premium version of Power BI if you want to import and utilize any more data. Users have also reported that Power BI takes longer than normal or even hangs while processing millions of rows and columns of data.
Summary
This brings us to the end of our Power BI pros and drawbacks discussion. Despite some of Power BI’s basic drawbacks, we are confident that Power BI is an excellent solution for data visualization and analysis. Furthermore, Power BI is always improving, so we may anticipate better versions in the future.